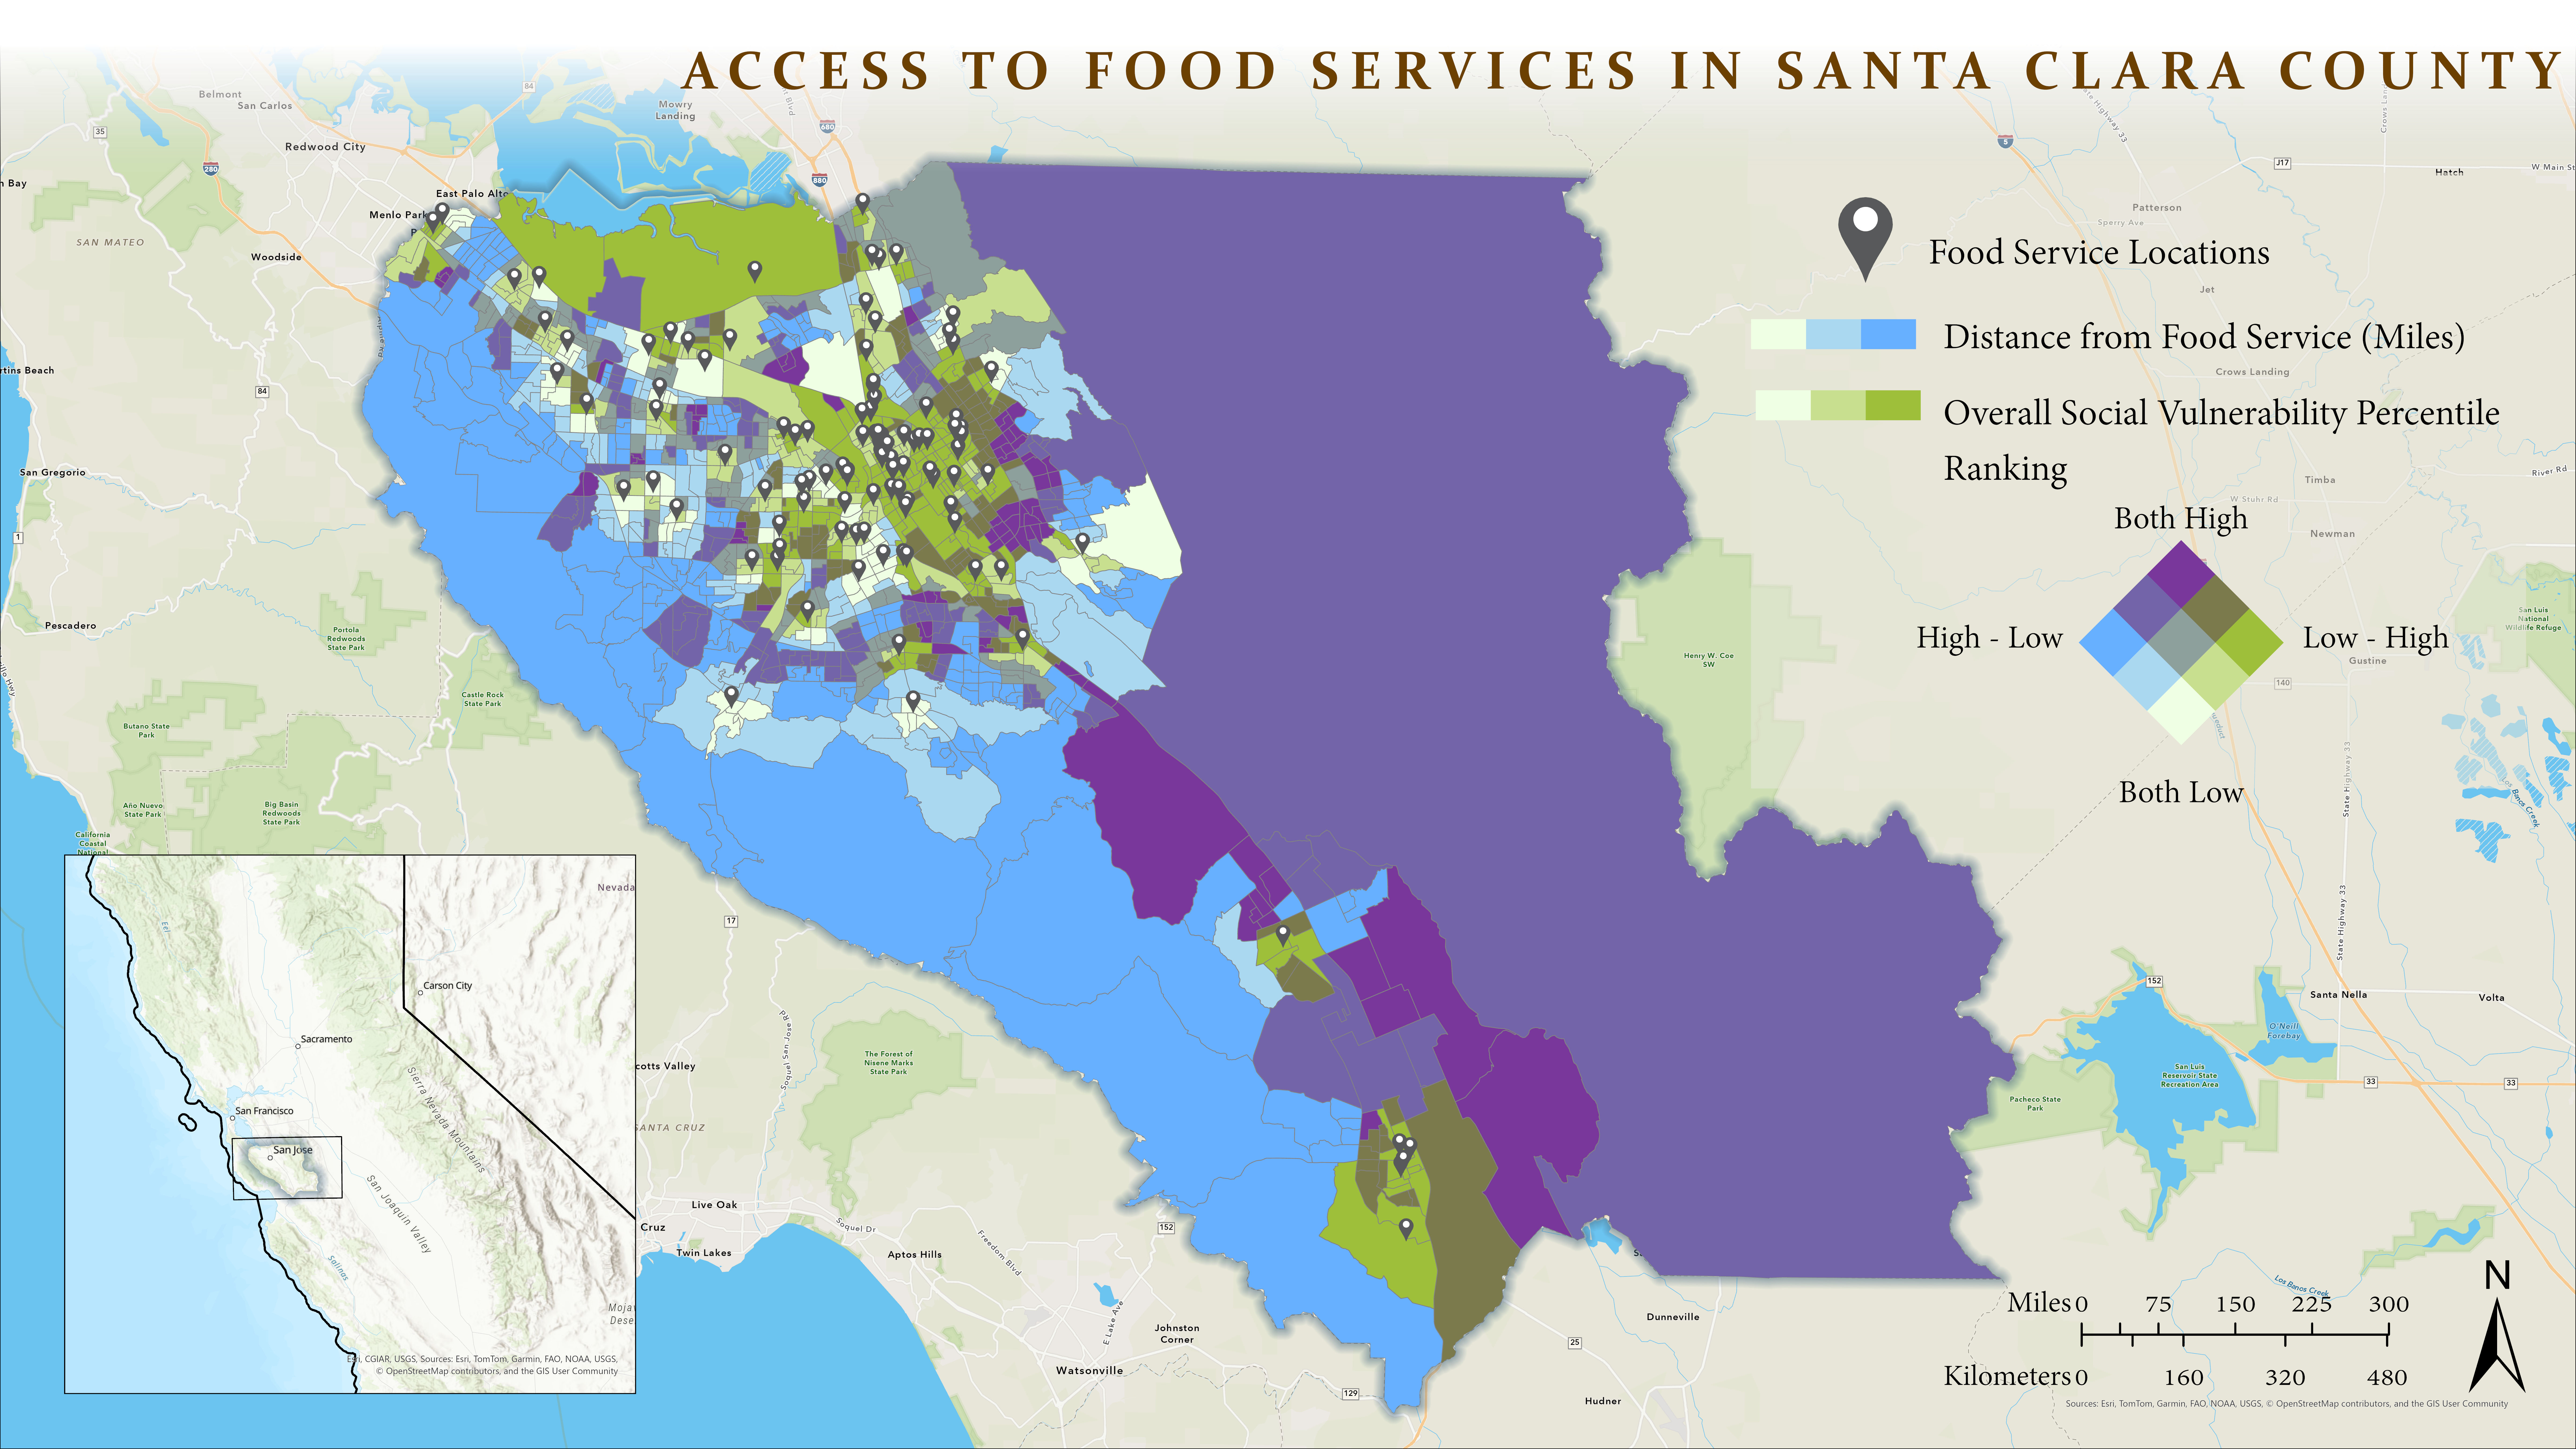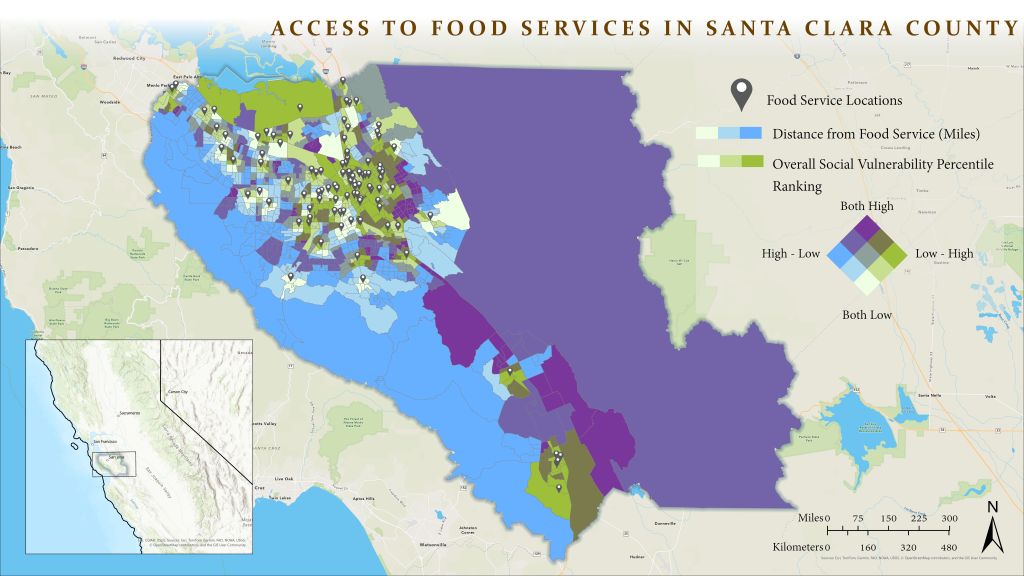
In collaboration with nonprofit Valley Verde,to identify areas with high need that lacked access to food services.
This layout was created entirely using ArcGIS Pro
I used census social vulnerability data and assembled food service location data myself. I used bivariate mapping to visualize census blocks which were both relatively far from any food services and had a high social vulnerability. This work was used by collaborators at the organization to inform further investigation into areas which needed higher investment into services for community members in need.